[back] Measles stats [back] Measles Statistics MMR MMR Urabe
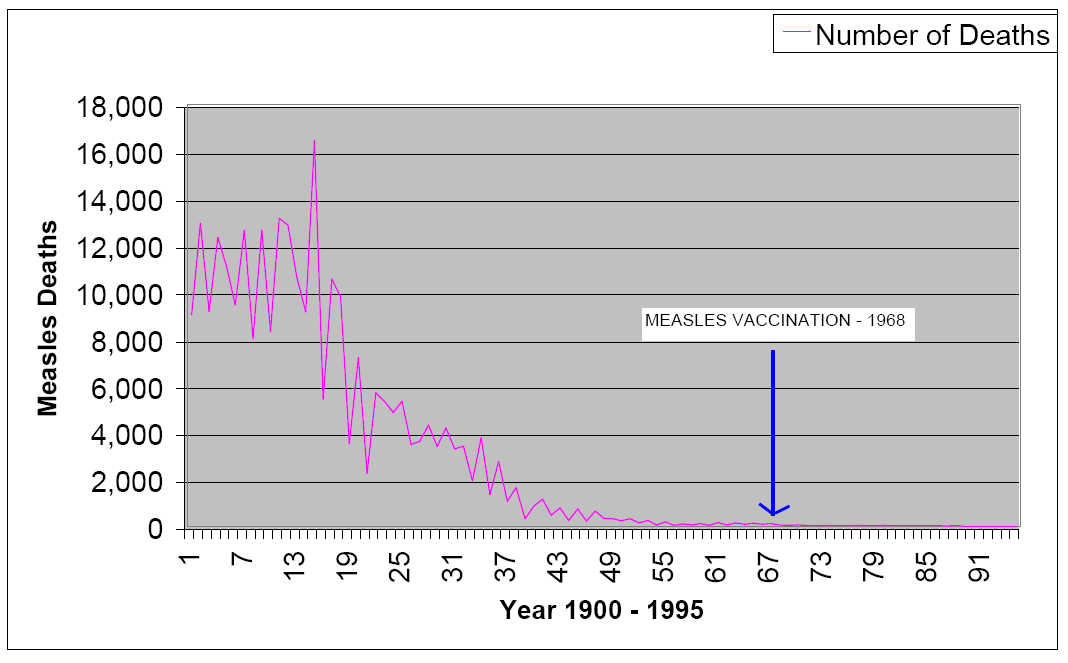
Measles deaths 1901 to vaccination![]()
[back] Measles stats
[back] Measles
Statistics
MMR
MMR
Urabe
[Measles deaths (from 1901/2, averaged) declined by 99.4% before vaccination in 1968! This proves vaccination played no part in the decline, yet parents are meant to believe (as shown by the Dr Siegal quote below) that vaccination was the ONLY factor.]
[The big measles lie] "It (measles) is ONLY not a big killer in the United States because of the MMR vaccine."---Dr Marc Siegal. (Feb 3, 2010 Fox News)
(Source: Twentieth Century Mortality CD, Office of National Statistics, 1 Drummond Gate, SW1, UK--0207 233 9233 02075335243. ICD classifications are done by the World Health Organisation)
"The measles death decline graph provided shows that the measles vaccine had nothing to do with the decline in deaths, and has not affected the number of children hospitalised during epidemic years since its introduction."----MEASLES : THE REAL FACTS-----HILARY BUTLER
Vaccination against measles was introduced in 1968 but abandoned because of lack of effectiveness and unpleasant side effects. A new, more potent, live vaccine was introduced in 1974 and is now being given to about 50 per cent of children aged 1-2. Whooping Cough vaccination--Prof Gordon Stewart (1980)
See: Graph propaganda.
Measles deaths 1901-1995 graph pdf
[HPA] Measles notifications and deaths in England and Wales, 1940-2007
Cause of Death by
Measles in England 1850/1860/1870/1880/1890
Measles deaths 1853-1890 England
Measles Mortality USA 1912-1975
All measles deaths by population 1901-1995
[June 3, 2007 Letter] Boston Globe Publishes Bunk by Paul Offit


''Vaccination against measles was introduced in 1968 but
abandoned because of lack of effectiveness and unpleasant side effects. A new,
more potent, live vaccine was introduced in 1974 and is now being given to about
50 per cent of children aged 1-2''. Whooping Cough vaccination--Prof Gordon Stewart
(1980)
Year |
Deaths |
Population |
Deaths per million |
| 1901 | 9,019 | 32,612,100 | 276.55379 |
| 1902 | 12,930 | 32,950,800 | 392.40321 |
| 1903 | 9,150 | 33,293,400 | |
| 1904 | 12,306 | 33,731,300 | |
| 1905 | 11,076 | ||
| 1906 | 9,444 | ||
| 1907 | 12,625 | ||
| 1908 | 8,011 | ||
| 1909 | 12,618 | ||
| 1910 | 8,302 | ||
| 1911 | 13,128 | ||
| 1912 | 12,856 | ||
| 1913 | 10,644 | ||
| 1914 | 9,133 | ||
| 1915 | 16,445 | ||
| 1916 | 5,411 | ||
| 1917 | 10,814 | ||
| 1918 | 9,787 | ||
| 1919 | 3,532 | ||
| 1920 | 7,190 | ||
| 1921 | 2,241 | ||
| 1922 | 5,694 | ||
| 1923 | 5,316 | ||
| 1924 | 4,834 | ||
| 1925 | 5,337 | ||
| 1926 | 3,483 | ||
| 1927 | 3,622 | ||
| 1928 | 4,302 | ||
| 1929 | 3,388 | ||
| 1930 | 4,188 |
| 1931 | 3,288 | ||
| 1932 | 3,411 | ||
| 1933 | 1,937 | ||
| 1934 | 3,769 | ||
| 1935 | 1,349 | ||
| 1936 | 2,751 | ||
| 1937 | 1,052 | ||
| 1938 | 1,633 | ||
| 1939 | 310 | ||
| 1940 | 855 | ||
| 1941 | 1,144 | 38,743,000 | |
| 1942 | 458 | ||
| 1943 | 769 | ||
| 1944 | 243 | ||
| 1945 | 728 | ||
| 1946 | 203 | ||
| 1947 | 644 | ||
| 1948 | 326 | ||
| 1949 | 307 | ||
| 1950 | 221 | ||
| 1951 | 317 | ||
| 1952 | 141 | ||
| 1953 | 245 | ||
| 1954 | 50 | ||
| 1955 | 176 | ||
| 1956 | 30 | ||
| 1957 | 95 | ||
| 1958 | 49 | ||
| 1959 | 98 | ||
| 1960 | 80 |
| 1961 | 152 | ||
| 1962 | 39 | ||
| 1963 | 166 | ||
| 1964 | 73 | ||
| 1965 | 115 | ||
| 1966 | 80 | ||
| 1967 | 99 | 48,272,100 | 2.0508741 |
| 1968 | 51 | ||
| 1969 | 36 | ||
| 1970 | 42 | ||
| 1971 | 28 | ||
| 1972 | 29 | ||
| 1973 | 33 | ||
| 1974 | 20 | ||
| 1975 | 16 | ||
| 1976 | 14 | ||
| 1977 | 23 | ||
| 1978 | 20 | ||
| 1979 | 6 | ||
| 1980 | |||
| 1981 | |||
| 1982 | |||
| 1983 | |||
| 1984 | |||
| 1985 | |||
| 1986 | |||
| 1987 | |||
| 1988 | |||
| 1989 | |||
| 1990 |